Outdoor Recreation · Water & Rivers
Paddling small rivers: how to read a stream gauge before you go
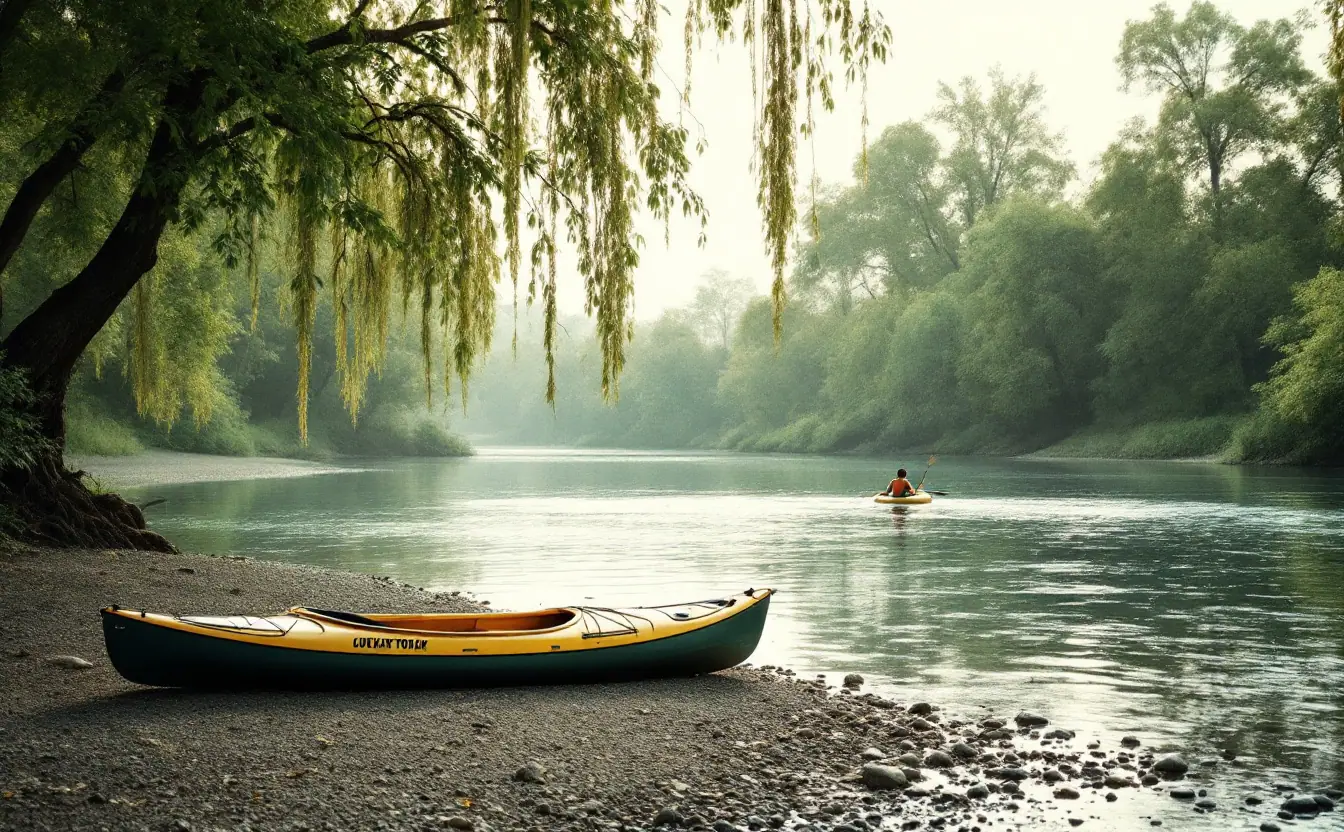
The difference between a great day on a small river and a miserable one is often a few inches of water. Too little, and you spend the afternoon dragging a boat over gravel bars and grinding the bottom off a canoe you love. Too much, and a friendly riffle turns into a fast, pushy chute with trees in it. A stream gauge tells you which day you are getting before you load the car, and reading one well takes about five minutes once you know what you are looking at.
This is a step-by-step for doing exactly that on the water most of us actually paddle: creeks and small rivers, the stretches that come up fast after rain and drop out just as fast. The method is the same in an Appalachian hollow, on an Ozark spring run, or on a snowmelt stream coming off the Rockies in June.
What a gauge actually measures
Most of the gauges paddlers use in the U.S. are operated by the U.S. Geological Survey, often in partnership with states and local agencies, and their readings appear on the USGS water data site. A typical station is a small shelter on the bank with a sensor in the river. It logs the water level at short, regular intervals, commonly every 15 minutes, and sends the data out several times a day or more.
Two numbers matter. Gage height, also called stage, is the height of the water surface above a fixed reference point at that station, in feet. It is not the depth of the river. A reading of 1.5 feet does not mean the water is a foot and a half deep, and 3 feet on one river can be a trickle while 3 feet on another is a flood. Stage only means something compared with other readings from the same gauge.
Discharge, or streamflow, is how much water is moving past the station, measured in cubic feet per second (cfs). The gauge does not measure this directly. Hydrographers wade or boat across the channel at intervals, measure depth and velocity, and build a rating curve that converts stage into flow. When a flood rearranges the riverbed, that curve shifts, which is why recent numbers are marked provisional and may later be revised.
Flow is usually the more useful number for comparing one day with another, and many guidebooks list runnable ranges in cfs. Others use stage. Use whichever your source used, from the same gauge, and you will be fine.
Step by step: reading a gauge for your trip
1. Find the right gauge
The best gauge sits right on the stretch you plan to paddle. Next best is one just upstream or downstream with no big tributaries in between. Pull up a map of the watershed and look for side streams. A large creek entering between the gauge and your put-in adds water the gauge never sees, and if the gauge sits downstream of your run, its reading includes tributaries below you, so your stretch will carry less than the number suggests.
2. Get the runnable range from a good source
Guidebooks, paddling clubs and experienced local paddlers usually know the low, good and high numbers for popular runs. Write down three things together: the gauge name, the unit, and the range. A range without a gauge name is close to useless, and so is a stage number someone copied from a different station.
3. Place today's number in that range
With the range in hand, today's reading falls into one of a few bands:
- Below the minimum: scraping, walking the riffles, dragging boats. Fine for a swim day, poor for a trip.
- Low: technical and slow, with rocks everywhere, but usually forgiving if you swim.
- Medium: the sweet spot most guidebook descriptions are written for.
- High: fast, with bigger waves, fewer and smaller eddies, and wood that is much harder to avoid.
- Flood: the river is in the trees. Do not go.
4. Look at the trend, not just the dot
Open the hydrograph for the past several days. A small river can rise sharply within hours of a hard rain and fall back over a day or two, so a reading that sits in range but is climbing steeply may be well above range by the time you reach the put-in. A steady fall after a storm is often a great day, as long as you stay alert for fresh wood the high water moved.
Snowmelt rivers in the West run on a daily cycle. Cold nights slow the melt and warm afternoons speed it up, so flows often peak late in the day near the mountains and later still downstream, which can make a June morning run noticeably easier than an evening one. Dam-controlled rivers show a different pattern again, with flat lines and sudden steps when releases change, so check the dam operator's posted release schedule as well.
5. Work out the lag
Water takes time to travel. If your gauge is upstream, what it reads now reaches your stretch some hours later; if it is downstream, it shows what already passed you. The easiest way to learn the lag is to watch a few storms. Pull up an upstream and a downstream gauge on the same river and note the hours between the two peaks. Write that number down, because it rarely changes much for a given reach.
6. Check the sky over the whole watershed
Look at the forecast and radar for the entire basin, not just the put-in. A summer thunderstorm parked over the headwaters can raise a creek under blue sky miles downstream, and in steep country that rise can arrive fast. The National Weather Service forecasts at weather.gov include river forecasts for many larger gauges, though small creeks rarely get one.
7. Check the water temperature
Some gauges report water temperature alongside stage and flow. Snowmelt rivers in June and spring-fed Ozark streams run cold even on hot days, and a swim in cold water takes your breath away before it does anything else. Dress for the water, not the air.
8. Confirm with your own eyes
At the put-in, look at a fixed reference you can come back to: a particular rock, a bridge pier, the riffle just below the launch. If the river looks higher or lower than the gauge suggested, trust what you see and adjust. Gauges fail now and then from debris, ice, sensor problems or gaps in transmission, and a flat line or missing data tells you nothing at all.
9. Make the call and set a bail-out
Decide before you are on the water, not halfway down. Know your take-outs, the roads near the river and where you could walk out if needed. Agree as a group on a simple rule, such as turning back if the first rapid looks bigger than the description, so nobody has to argue about it in the moment.
10. Write it down
After the trip, log the date, the gauge reading, the trend and what you saw: rock at the put-in just covered, scraped at the second riffle, pushy below the bridge. Over a season you build your own rating for every river you paddle. It is the same patient habit volunteer water watchers build, and our beginner's guide to volunteer stream monitoring shows how far a good notebook can go.
When the numbers do not tell the whole story
A gauge tells you how much water there is. It says nothing about what is in it. After any high water, expect new strainers, fallen trees or debris piles that let water through and pin anything solid against them, and they rank among the most serious hazards on small rivers. Scout blind bends, and portage when in doubt.
Low-head dams deserve their own warning. These uniform concrete weirs across the river look harmless from upstream, but the recirculating backwash below them can hold a swimmer, a boat and a rescuer alike. Portage them at every water level, every time. Watch bridges at high water too, since clearance shrinks quickly and debris collects on the piers.
Ungauged creeks are a judgment call. You can use a nearby gauge on a stream of similar size and terrain as a rough proxy, combined with rainfall totals, but scout more and expect surprises. Gauges also change: when a station is rebuilt or moved, its stage numbers can shift, which makes old guidebook ranges in feet go stale. Flow ranges in cfs survive those changes better, which is one more reason to prefer them.
Many stations log more than water level, including temperature, conductivity or turbidity. Our piece on reading a water quality report for your local stream explains what those extra lines mean, and our guide to public maps and data tools covers other water data worth bookmarking.
The five-minute version
On the morning of a trip, the routine shrinks to a few quick looks. Check the right gauge, compare the number to your range, read the trend over the last few days, look at the radar upstream, and remember the lag. Then drive, look at your reference rock, and decide.
On a good day it all lines up. The hydrograph is easing down from a weekend storm, the rock at the put-in shows just a skim of water over its top, and the first riffle below the launch has exactly enough water to float you through without a scrape.
Hollow & Headwater is an independent publication. Nothing here is official guidance – for permits, rules or emergencies, go to the relevant public authority.