Water & Rivers · Science & Explainers
How to read a water quality report for the stream down the road
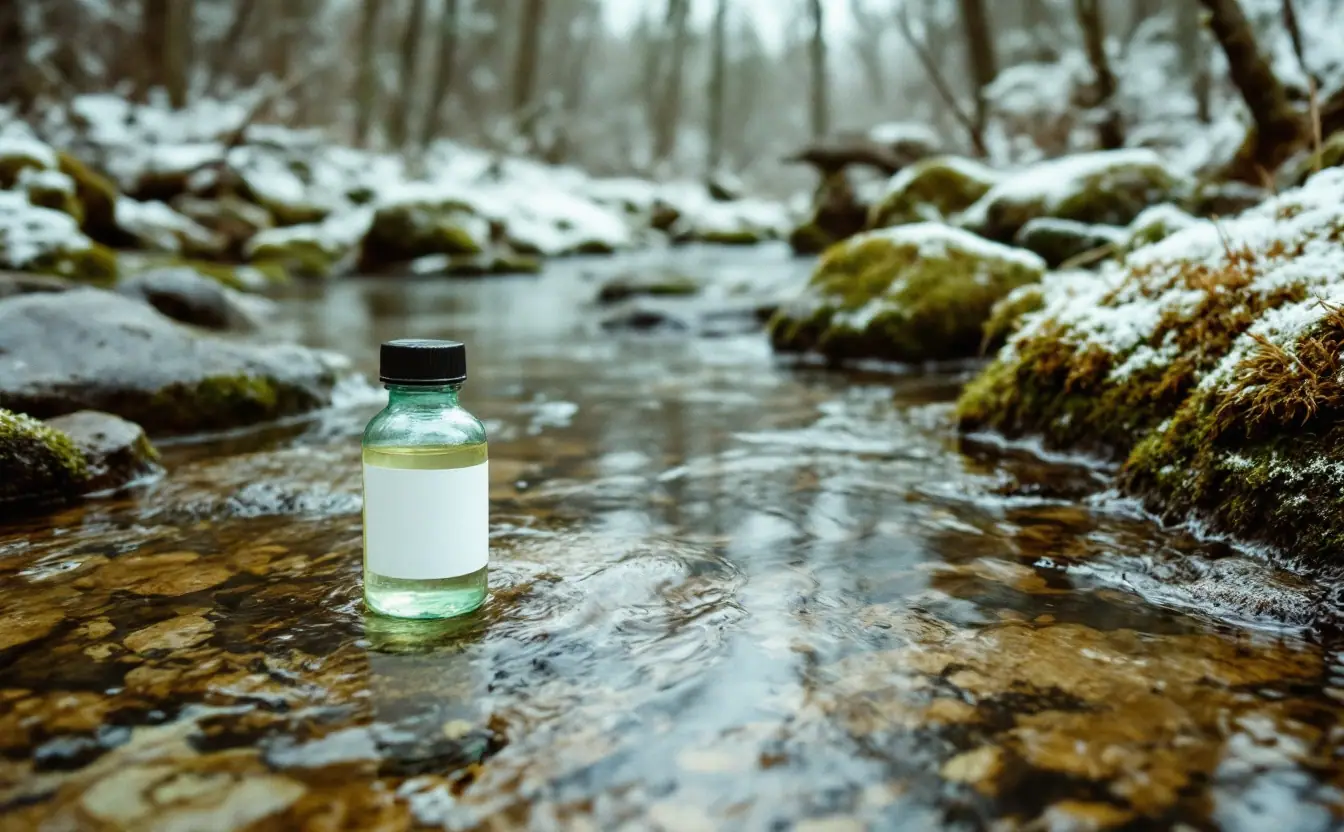
Somebody hands you a stream report, or you find one posted by a watershed group, and it looks like the back of a cereal box written by a chemist. Rows of abbreviations. Columns of decimals. A few cells with a less-than sign and nothing else, and a letter J floating next to a number as if someone sneezed on the keyboard.
I spent years filling in sheets like that for a university lab, standing in riffles with numb fingers, and the report is friendlier than it looks. Most of it answers a handful of plain questions. How warm was the water? How much oxygen was in it? What was dissolved in it, and what was floating in it? Once you know which row answers which question, the page starts to read like a description of a place.
Where reports come from
Stream data reaches the public through a few doors. State water programs sample fixed stations on a rotating schedule. The U.S. Geological Survey runs gauging stations, and some of them carry sensors that log temperature, conductivity or dissolved oxygen every few minutes; you can browse them at USGS Water Data. Universities run studies, and watershed associations and volunteer groups sample their own creeks, sometimes for decades. Our guide to public maps and data tools walks through where to look.
The source matters because it tells you how the numbers were made. A lab analysis of a bottled sample, a handheld meter reading and a color-matching test kit can all report "nitrate," but they carry different levels of precision. Good reports say which method was used. If yours doesn't, that's the first question to ask whoever published it.
Start at the top of the page
Before you look at a single result, read the header. You want the site name or ID, a description of where it is (above or below a town, a road crossing, a tributary), the date, and the time of collection. Skipping this is like reading a thermometer without knowing whether it was hanging in the sun.
Time of day is a bigger deal than most people expect. Dissolved oxygen in a sunny, algae-rich stream rises through the day as plants photosynthesize and falls overnight as everything in the water respires. A reading at 3 p.m. can look healthy while the same water hits its low point just before dawn. Temperature runs on its own daily cycle, usually warmest in late afternoon.
Then look for anything about flow. A note like "base flow" or "storm event," or a discharge value in cubic feet per second, changes how you read everything below it. After heavy rain, sediment and bacteria wash in from the land and turbidity can jump many times over within hours. During a long dry spell there's less water to dilute whatever is dissolved, so conductivity creeps up.
Units and the small print
A few unit conventions trip up almost everyone. These are worth memorizing:
- mg/L (milligrams per liter) is roughly the same as parts per million. µg/L is a thousand times smaller, roughly parts per billion. Metals and some nutrients are often reported in µg/L, so a "20" there is not the same as a "20" in mg/L.
- µS/cm (microsiemens per centimeter) is the unit for conductivity. "Specific conductance" means the value has been corrected to a standard temperature of 25 °C, so readings from cold and warm days can be compared.
- NTU is the unit for turbidity, a measure of how much light the water scatters.
- CFU or MPN per 100 mL is how bacteria are counted: colony-forming units, or the most probable number, in a 100-milliliter sample.
- Nitrate "as N" versus "as NO₃": the same nitrate can be reported either way, and the "as NO₃" figure is about 4.4 times larger. Check which one you're looking at before you compare two reports.
Then there are the qualifiers. A result written as "<0.05" means the lab looked and found less than it can reliably report, not zero. "ND" means not detected. Many labs use "J" for an estimated value, detected but below the level where they'd vouch for the exact number, and USGS data often uses "E" in a similar way. Codes vary by lab, so look for the key, usually at the bottom of the report.
The parameters, row by row
Here are the rows you'll meet most often. The last column isn't a set of official limits, which depend on your state and how a stream is classified; it's the kind of result that makes me look twice.
| Parameter | Usual units | What it tells you | What makes me look twice |
|---|---|---|---|
| Water temperature | °C | How much oxygen the water can hold, and which fish and insects can live there | A trout stream running warm through summer afternoons |
| Dissolved oxygen (DO) | mg/L and % saturation | Oxygen available to gills | Low readings, especially near dawn; saturation far above 100% on a sunny afternoon |
| pH | standard units | Acidity, on a logarithmic scale | Values below about 6 or above about 9 |
| Specific conductance | µS/cm | Total dissolved ions such as salts and minerals | A sudden jump compared with upstream or with past samples |
| Turbidity / suspended solids | NTU / mg/L | Cloudiness and sediment load | High values on a day with no rain |
| Nitrate-nitrogen | mg/L as N | Influence of fertilizer, manure, septic systems and wastewater | A steady climb over several seasons |
| Total phosphorus | mg/L | Fuel for algae | Any upward trend; small decimals matter here |
| E. coli | CFU or MPN per 100 mL | Fecal contamination from people, livestock, pets or wildlife | Repeatedly high counts at base flow |
A few of those rows deserve more than a table cell. Here's what I'd want a friend to know about them.
Temperature and oxygen travel together. Cold water holds more gas. Near freezing, fully saturated water holds roughly 14 to 15 mg/L of oxygen; at a warm 25 °C it holds a little over 8. That's why a brook trout stream in the Smokies or a salmon creek in western Washington can lose fish in a heat wave even when nothing has been dumped in it. Many states treat about 5 mg/L as a floor for warmwater fish, and coldwater species want more.
Percent saturation is the tell for algae. A reading of 130% on a bright August afternoon sounds like a bonus. Usually it means a thick growth of algae is pumping oxygen out by day and will pull it back down at night.
pH is logarithmic. A pH of 5 is ten times more acidic than 6 and a hundred times more acidic than 7. Most healthy streams sit somewhere around 6.5 to 8.5, depending on the rock they drain. A creek running off limestone in the Ozarks naturally reads higher than one draining sandstone and peat on a high Appalachian plateau.
Conductivity is a fingerprint. It won't tell you what's dissolved, only how much, which makes it most useful in comparison. A Lake Michigan tributary that reads far higher below a highway interchange in February than above it is telling you about road salt. A creek in a coal valley that reads high all year may be carrying sulfate from old mine workings, which we cover in our piece on acid mine drainage.
Numbers against standards
Many reports print a standard or criterion next to each result, or shade the cells that exceed it. Those benchmarks come from state water quality standards, which depend on what a stream is designated for: coldwater fishery, warmwater fishery, swimming, a drinking water source. The same E. coli count can be fine for one designation and a problem for another.
Bacteria get special handling. Counts swing wildly from sample to sample, so benchmarks are usually written as a geometric mean of several samples taken over weeks, which dampens the effect of one wild result. The U.S. EPA's recreational water quality criteria, for instance, use a geometric mean of 126 E. coli per 100 mL as one benchmark. A single sample in the thousands the morning after a thunderstorm is worth noting, but it does not by itself mean the creek is permanently unsafe. Five high samples in a row during dry weather mean something else entirely.
For anything involving health, treat the report as background and check your state's current advisories or standards for the official word. A report explains what was found on a given day. It doesn't decide what you should do this afternoon.
Look for patterns, not single readings
The most useful habit is to read across and down instead of fixating on one cell. Three comparisons answer most questions:
- Upstream versus downstream. If a reading changes sharply between two stations, the cause is probably between them: a road, a pipe, a pasture, a tributary.
- Wet versus dry. Problems that show up only after rain usually come off the land. Problems that show up in dry weather often point to a steady source, like a failing septic field or a discharge.
- This season versus past seasons. One summer of warm readings might be weather. Ten years of slowly rising nitrate across a Plains watershed is a trend.
A long record from a single, faithfully sampled site is worth more than a scatter of one-off visits. That's one reason volunteer stream monitoring matters so much: patient people visiting the same riffle, the same way, year after year.
The bugs column
Some reports include a biological score, often built from samples of aquatic insects. Chemistry is a snapshot of the minute the bottle was filled, but the mayflies, stoneflies and caddisflies under the rocks have been living in that water for months. They integrate everything: the heat wave in July, the salt pulse in January, the spill nobody noticed.
The common shorthand is EPT, for those three insect orders, which tend to be sensitive to pollution. A riffle full of flat-bodied mayflies clinging to the undersides of stones is good news no matter what one bottle said. A riffle with only midge larvae and aquatic worms is telling you something the chemistry might have missed.
What a report can't tell you
It can't tell you whether stream water is safe to drink; untreated surface water should never be trusted. It can't tell you whether the swimming hole is fine today, because conditions change with every storm. And it can't tell you about what wasn't measured. A report with no pesticide results doesn't mean there are no pesticides, only that nobody tested for them.
What it can do is give you better questions. Next time you head to the creek, bring the report along and stand at the site. Look upstream and find the culvert, the cattle crossing, the patch of bare bank, the spring seeping out of the hillside. The numbers make a lot more sense once you've had cold water over your boots at the spot where they were taken.
Hollow & Headwater is an independent publication. Nothing here is official guidance – for permits, rules or emergencies, go to the relevant public authority.